Web scraping cannabis big data: a search for botanical insight on lucrative problems
Details of cannabinoid findings in SC Labs dataset from 2015
Intro
Although there is a wealth of data available online for Cannabis there is a scarcity of structured big data to gain insight into cannabinoid potency within state and national cannabis markets.
In an effort to glean more about the California cannabis market I performed what is called a "web scrape" or download of public facing potency data from SCLabs in the fall of 2015. On that date potency data for 2000+ samples was downloaded.
A "web scrape" is a common procedure performed by internet search engines to download a website and index the content.
Potency data was then extracted from the html files and "cleaned" into a large table using a combination of command line tools in linux (to be detailed in future articles). The table was then graphed using the open source R programming language.
The following data figures are what I would like to consider a "bird's eye view of the cannabinoid landscape in 2015" as seen from a testing lab.
Back then, and even more so now, I was concerned and motivated to understand the prevalance of high CBD flower and extracts in the market. I knew that there was at the time a scarcity of CBD products available in stores and this trend would show through in a testing dataset.
Fortunately, for you the reader, I could only understand CBD trends within the context of other cannabinoids in the dataset. Therefore, I will paint a full picture of what was in the dataset as a whole and then focus on what I would consider pieces of insight.
Graphical Results
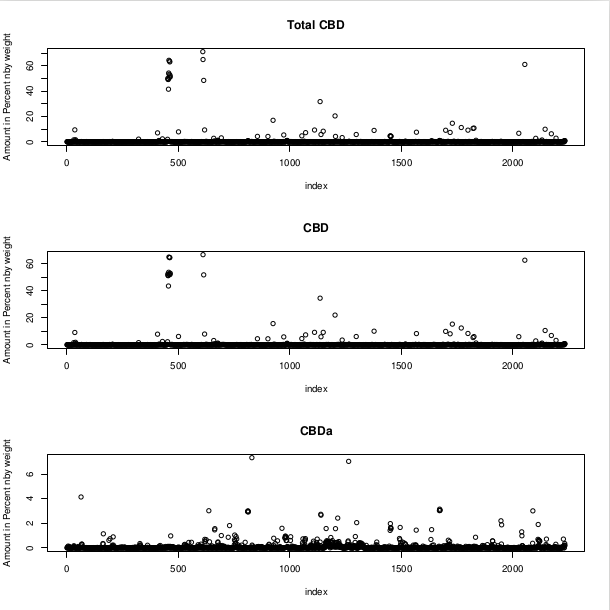
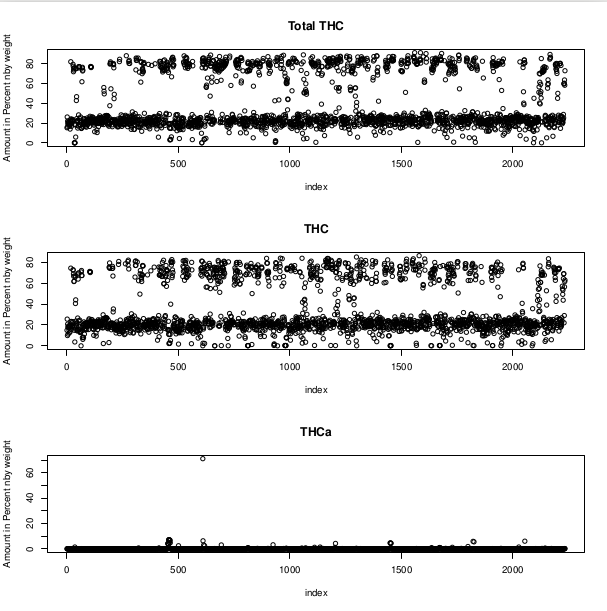
To start let's get a gander at what this "cannabis big data" looks like for THCA, THC, CBDA and CBD...

Discussion
So, I have to say WOW, it is so clear the difference between the total amount of THC in samples vs CBD. I had already observed this in the market and it was nice to see the disparity is so visually apparent.
To back up a minute and describe basics of these graphs. The horizontal x-axis is the sample index and the y-axis is the potency value as percent by weight (a common measure).
Total THC (TTHC) is the total potential THC available if we are to decarboxylate the THCA available in the sample is usually calculate by TTHC = THCA*0.877+THC (this will be explained in detail in the article about decarboxylation). Total CBD (TCBD) is calculated similarly.
It is actually more informative to see both THC and CBD potency from each sample on the same graph, but I wanted us to start here.
THC trends
There is a lot to take in from these data figures. Let's start by mentioning that there are two clear domains of values for THC. This is due to the fact that this dataset is a merge of potency tests from samples of flowers, extracts and edibles.
Therefore, the values around and below 20% total THC are from flower samples whereas the values above 60% total THC are from extracts such as distillate.
Note that there is only one sample above 60% THCA in the dataset. Thus, the frequency of a high THCA sample was 1 in 2000. I can only guess that it was a "THCA diamond" that precipitated out from a cold butane extraction. That THCA extract must've been even more rare and valuable then as they are now.
You see when heat is applied to the extract or flower the THCA degrades into what we know and love as delta-9-THC, so whomever prepared that extract took great care to extract and preserve the native acid form.
CBD trends
OK, so you may have noticed that only two samples are above 6% CBDA and a handful are around 4% or lower. These are likely flower samples.
The majority of CBD values are low, as we expected with higher flower values coming in around 10%. Remember this dataset was from 2015 so the development of high CBD flower was just gaining momentum.
The extracts on the other hand have a range from 40-70% Total CBD. These were likely distillates made from flower extracts.
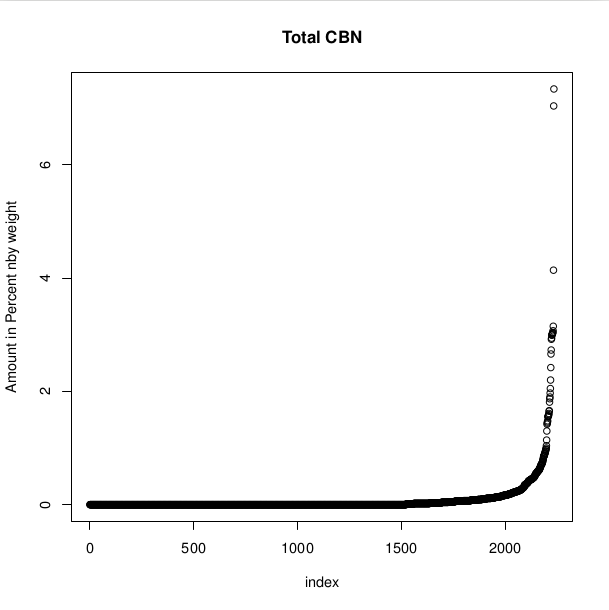
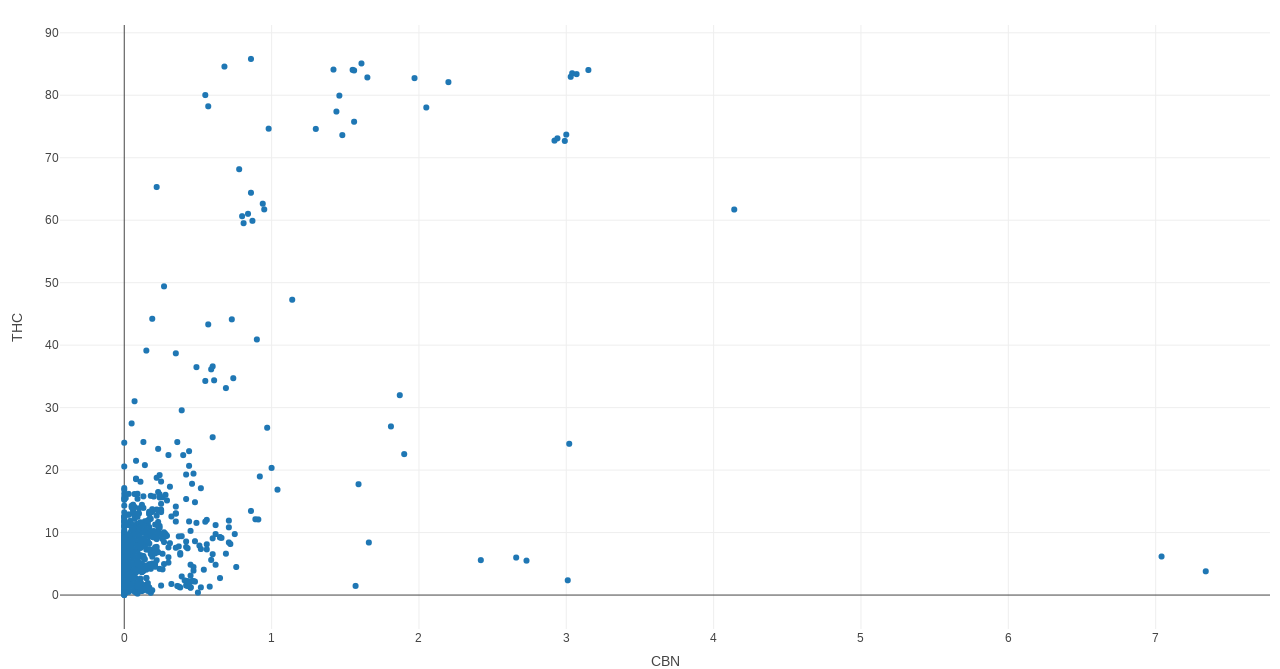
CBN trends
It may be interesting for you to know that about 500 samples had approximately 1.5-3.5% CBN, whereas two samples had as much as 6%. Typically flower have high CBN values when it approaches an age of a year or more, thus the 6% CBN samples were likely from a extracts that were oxidized through heat or age.
Total CBD (TCBD) vs Total THC TTC) trends
Now that we have seen the domains and outlying trends of the cannabinoids individually let's put this all together and see how THC and CBD values compared in the same samples.
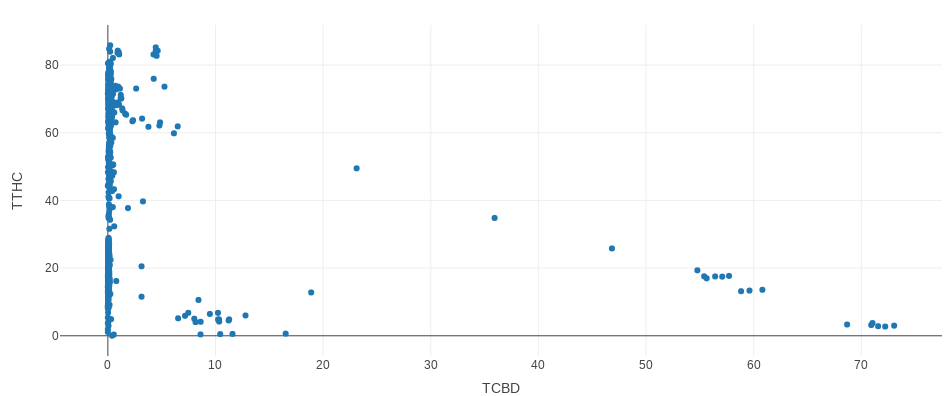
Notice a small subset of samples contain 10% TCBD also have 10% TTHC. These are at a 1:1 ratio common to products and rare in flower samples. The majority of samples are high THC. An interactive version of this chart above can be found here
It is even more visually apparent now the disparity of high CBD samples above 10%.
A good mention goes out to the samples that tested around 60% CBD and 20% THC a 3:1 ratio common to products and rare in flower samples.
Total CBN vs THCa
What is not suprising with this next chart is that when you excessively heat or age your cannabis product it will degrade the tetrahydrocannabinolic acid (THCA) into delta-9-tetrahydrocannabinol (THC) shortly thereafter the THC will degrade into CBN. We see this often with flower that is over a year old stored under poor conditions and also when the process to derive the extract utilized lots of heat.
Continuous heat is applied to the extract/product during dearboxylation and is required for distillation.
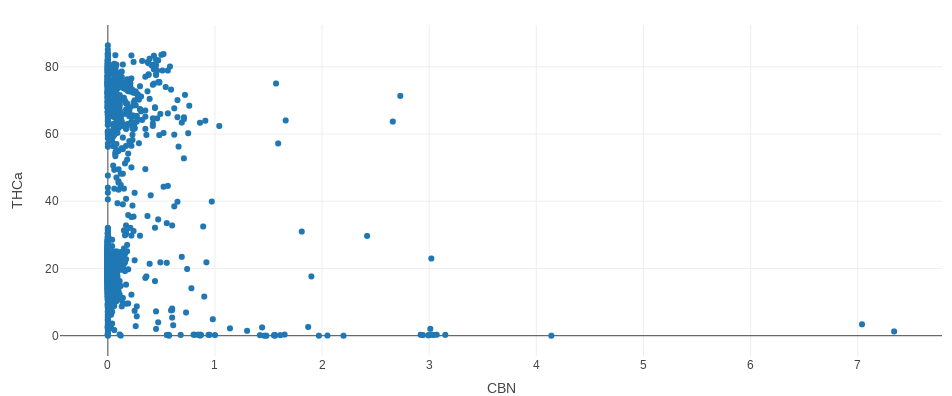
As we would have expected from cannabis first principles the samples with high CBN have little to no THCa. You can click an interactive version here.
It does beg the question how much THC is being degraded to CBN? To answer that we would have to test the sample before and after. All we can do is look at the next graph and see that a few samples have a very high THC at 75%, but seem to have to pass a wall of 1% CBN to get there.
Conclusion
This first post is topical and the analysis of the data is incomplete. Nonetheless, this first scrape of SC Labs inspired my lust for web scraping and the archival/analysis of cannabis big data available online. Deeper insight into this dataset may be gained by viewing trends specific to the sample types such as edible, flower, concentrate.
My goal was to have a global view whereby I could visually demonstrate the apparent disparity of high CBD and CBDA samples at the time and this was accomplished.
If this post and cursory examination of cannabis big data is of interest to you please sit tight and hold on for my future post on a more recent and comprehensive dataset from Conflabs.